Knowledge Graph vs Text: The Ultimate Augmentor for LLM Responses?
Using Claude 3.5 Sonnet, OpenAI GPT-4o and Gemini 1.5 Pro to identify the most effective response augmentor
This study investigates the role of knowledge graphs in enhancing the quality of responses generated by Large Language Models (LLMs). A knowledge graph is a structured representation of information, where entities are depicted as nodes and their relationships as edges, creating a network of interconnected data points derived from textual sources.
This study looks at three main questions:
How much can knowledge graphs help LLMs give better responses?
Which works better for LLMs: using knowledge graphs or just using textual information?
Does using both knowledge graph and textual together help LLMs give the best answers?
Methodology
This study conducted a comparative analysis of LLM-generated responses, enhanced by three different augmentors:
Textual information (source material)
Graph information (structural representation of the source material)
A combination of both textual and graph information.
The analysis was carried out in two stages. The first stage, generation, involved producing test specimens of LLM responses. In the second stage, evaluation, these generated responses were assessed for their effectiveness.
The top three leading frontier LLMs — Anthropic Claude 3.5 Sonnet, OpenAI GPT-4o and Google Gemini 1.5 Pro — were used for generation and evaluation purposes.
Stage 1: Generation
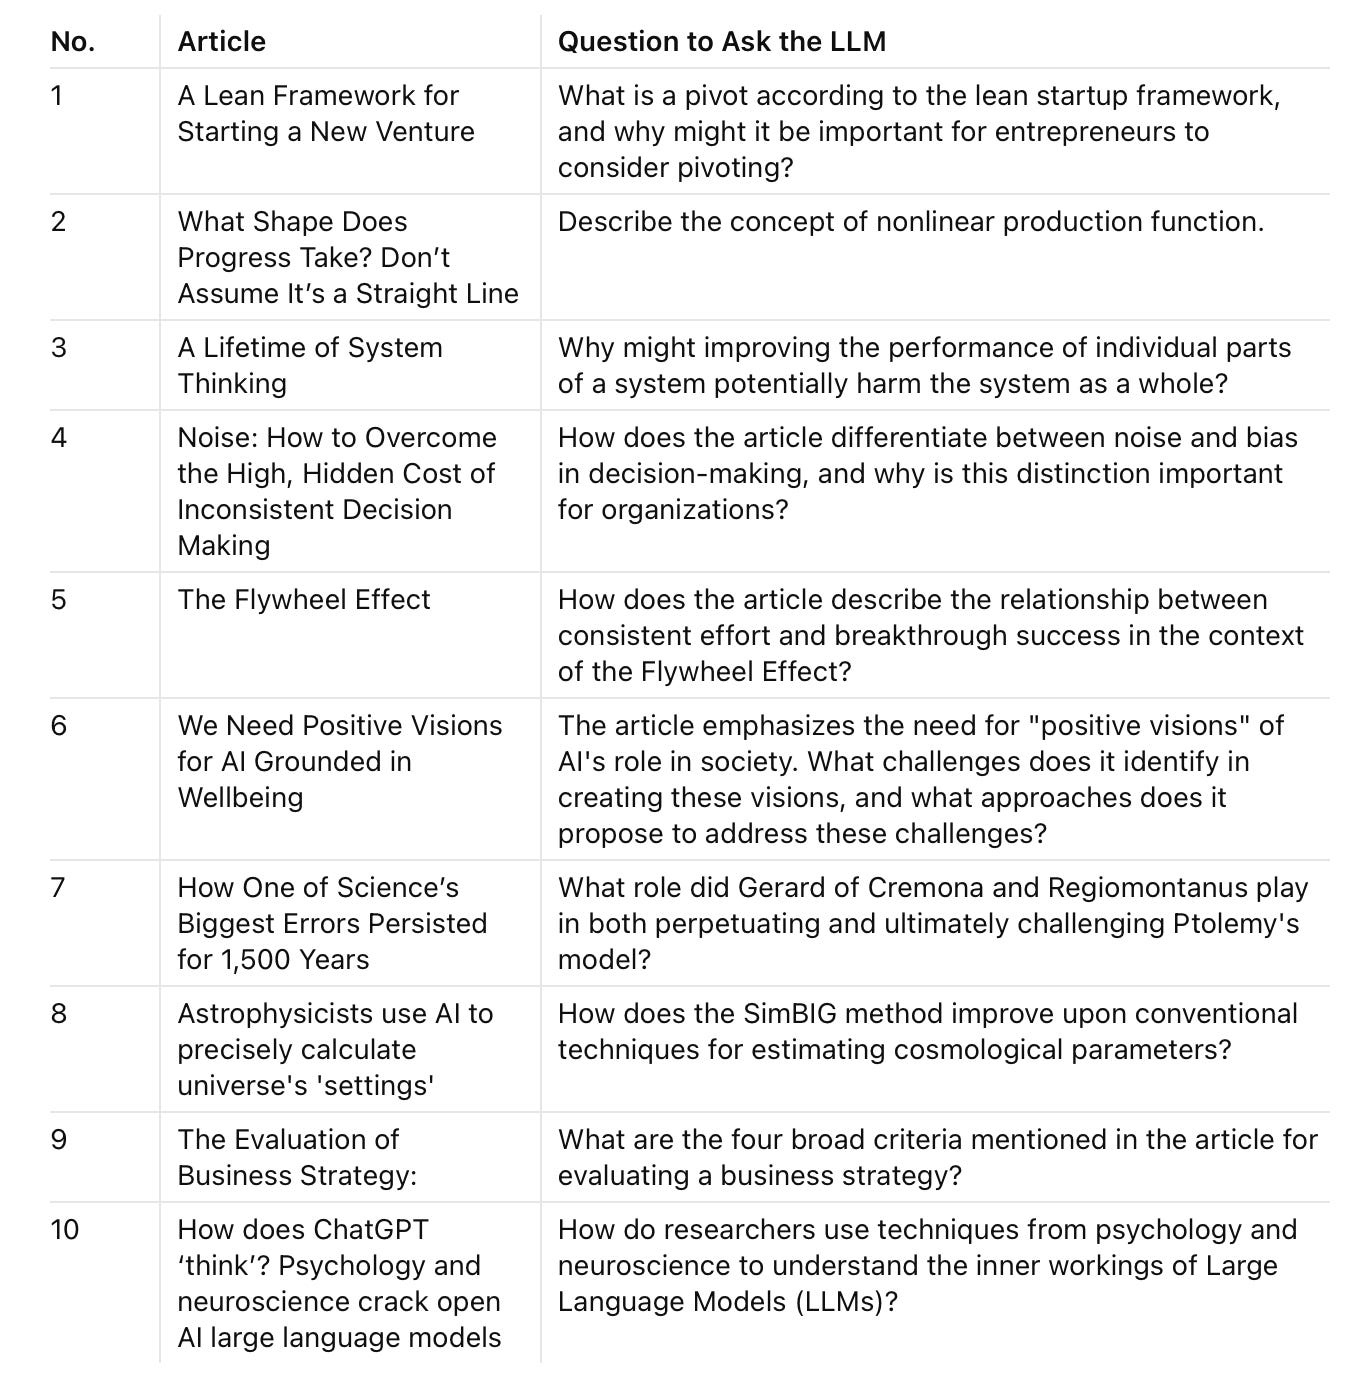
Ten online materials covering various subject matters were selected. These include:
A Lean Framework for Starting a New Venture (Springer)
What Shape Does Progress Take? Don’t Assume It’s a Straight Line (Behavioral Scientist)
A Lifetime of System Thinking (The Systems Thinker)
Noise: How to Overcome the High, Hidden Cost of Inconsistent Decision Making (Harvard Business Review)
The Flywheel Effect - An Excerpt from Good to Great by Jim Collins (AWS)
We Need Positive Visions for AI Grounded in Wellbeing (The Gradient)
How One of Science’s Biggest Errors Persisted for 1,500 Years (Atlas Obscura)
Astrophysicists use AI to precisely calculate universe's 'settings' (Phys.org)
The Evaluation of Business Strategy (University of Portland)
How does ChatGPT ‘think’? Psychology and neuroscience crack open AI large language models (Nature)
All articles were converted to PDF. Claude 3.5 Sonnet chatbot was used to generate Mermaid diagrams for each article. After the initial diagram output, a follow-up prompt to instruct Claude to rate the diagram (out of 5 rating). If it’s not rated 5/5, prompt the chatbot to fix deficiencies in order to make the diagram to achieve 5/5 rating and 100% alignment with the article.
A question was created for each article, designed to be straightforward, with answers directly available within the content. The questions are as follows:
For each article, using the same question, each LLM was instructed to generate responses grounded in the three augmentors. Specifically, each LLM generated three single-turn responses for each article:
Response A: Grounded in textual information
Response B: Grounded in graph information
Response C: Grounded in both textual and graph information
🔖 Click here to view all the prompts used in the generation stage.
A prompt with the same format, using identical wording except for the first line customized for each question, was used for all articles. Each response was generated in a new chat session to ensure compartmentalization. By limiting responses to a single turn, without follow-up prompts, variables were minimized, enabling fair comparisons.
The three LLMs generated a total of nine responses for each article, using the three different augmentors:
Stage 2: Evaluation
All ninety responses — nine per article across ten articles — were evaluated for quality by the three LLMs. The criteria used to assess quality include:
Faithfulness to source material
Clarity of explanation
Cohesiveness of insight
Coherence of structure
The evaluation prompt template consists of two sections: Instruction and Exhibit:
Instruction: This section provides detailed guidelines for the chatbot on how to conduct the evaluation of responses.
Exhibit: This section includes a set of responses generated by the Gemini chatbot: Exhibit 1 (text-augmented response), Exhibit 2 (graph) and Exhibit 3 (combination of text and a graph). These exhibits were evaluated in a blind test-equivalent. Response sets were anonymized, with no identifying marks linking them to the LLM that generated them. The chatbot rating each one according to the specified quality criteria.
🔖 Click here to view all the prompts used in the evaluation stage.
Each set of responses generated by an LLM was evaluated by three LLMs: the one that produced the responses and two others. The ratings for the ninety response sets were then recorded. Below is a sample evaluation of GPT-4o's responses by Claude:
Exhibit 1:
Criteria (a): 4.80/5.00 - Excellent alignment with the attached document, covering all four criteria in detail with accurate explanations.
Criteria (b): 4.50/5.00 - Very clear explanations for each criterion, providing specific examples and implications.
Criteria (c): 4.70/5.00 - Strong cohesiveness, with each criterion building upon the others to form a comprehensive view.
Criteria (d): 4.60/5.00 - Well-structured presentation, with a logical flow from one criterion to the next.
Overall Average Rating: 4.65
Exhibit 2:
Criteria (a): 3.20/5.00 - Partial alignment with the document, but uses different terminology and includes additional elements not present in the original.
Criteria (b): 3.80/5.00 - Clear explanations for each criterion, though some deviate from the original document's intent.
Criteria (c): 3.50/5.00 - Moderate cohesiveness, with some connections between criteria but lacking the integrated approach of the original.
Criteria (d): 4.00/5.00 - Good structure with a clear introduction, breakdown of criteria, and conclusion.
Overall Average Rating: 3.63
Exhibit 3:
Criteria (a): 4.90/5.00 - Near-perfect alignment with the attached document, accurately representing all four criteria.
Criteria (b): 4.70/5.00 - Excellent clarity in explanations, with relevant examples for each criterion.
Criteria (c): 4.80/5.00 - High cohesiveness of insights, demonstrating how the criteria work together in strategy evaluation.
Criteria (d): 4.40/5.00 - Good structure, though slightly less organized than Exhibit 1.
Overall Average Rating: 4.70
[Removed the following for brevity]
Results: Which Augmentor Produces the Best Response?
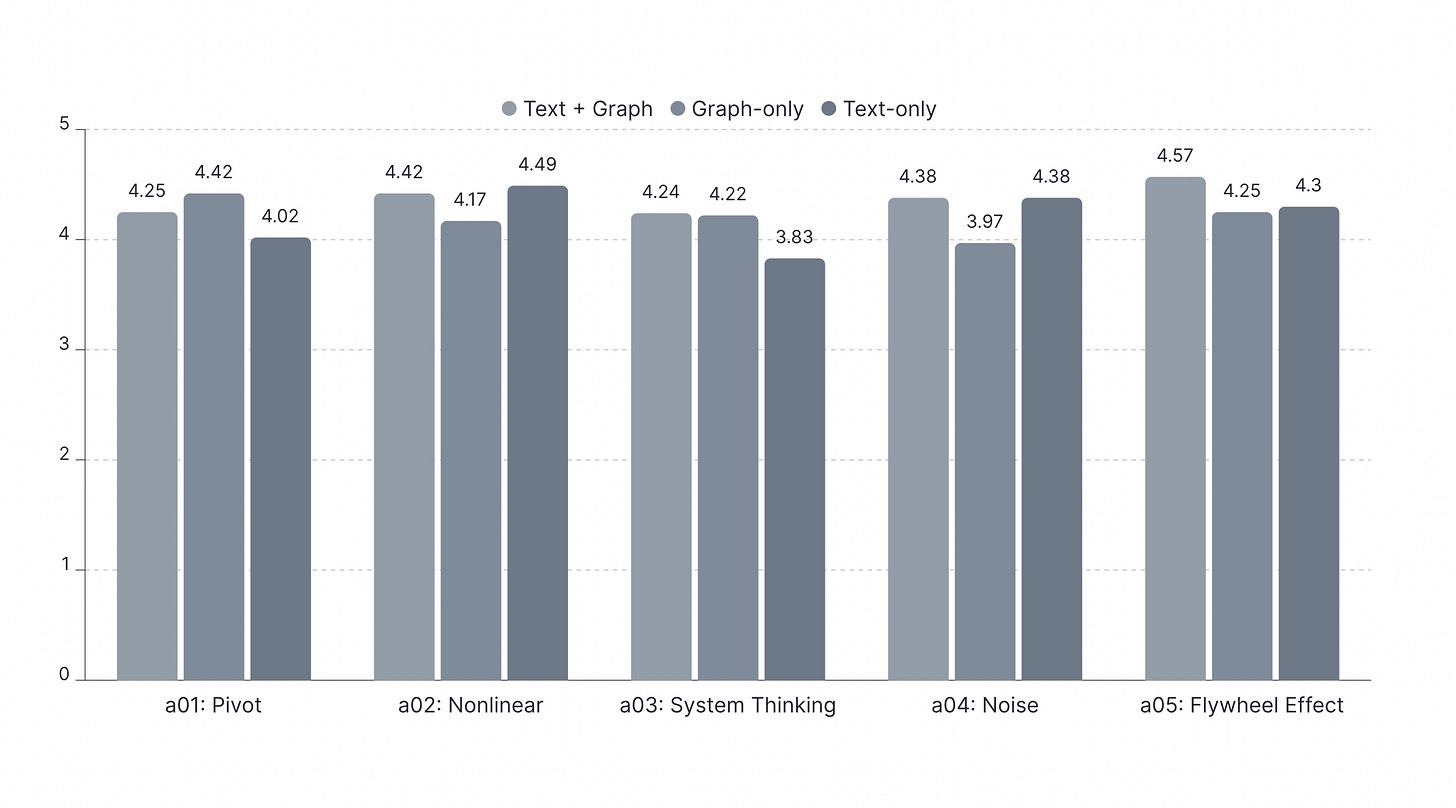
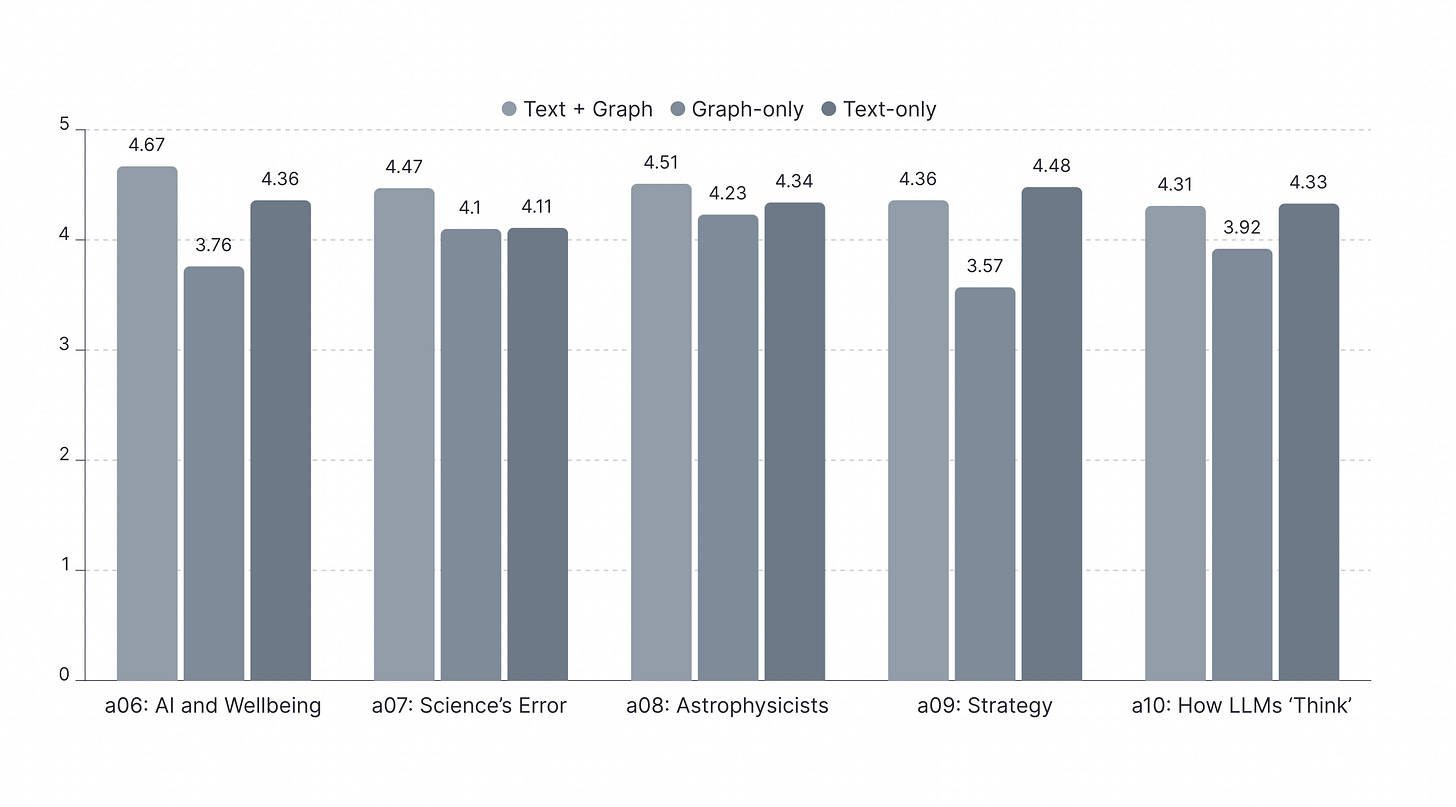
Overall, the combination of text and graph is the most effective augmentor for generating high-quality responses. Across ninety rounds of testing, responses enhanced by both text and graphs achieved the highest average score of 4.42. Text-only augmentation followed with an average rating of 4.26, while graph-only augmentation performed the worst, with an average rating of 4.06.
In terms of total first-place rankings across all testing rounds, the combination of text and graph is notably superior to both text-only and graph-only approaches. The text-and-graph combination achieved the highest number of first-place responses, with 52, representing 58% of all first-place rankings. It also had the fewest last-place responses, with only 11, accounting for 12% of all last-place rankings.
In comparison, the text-only approach achieved 24 first-place responses, or 27% of the total. Conversely, the graph-only approach had the highest number of last-place responses, totaling 50, which represents 56% of all last-place rankings.
Which model combined with which augmenter produces the best responses? The GPT-4o model, when combined with both text and graph, generated the highest percentage of first-place rankings at 38%, followed by the Claude 3.5 Sonnet with 35%.
Additionally, the Gemini 1.5 Pro model, when using graph-only or text-only augmenters, achieved the highest percentages of first-place rankings—43% with graph-only and 42% with text-only—compared to the other two LLMs.
Claude's responses, when augmented with a combination of text and graph, achieved the highest average rating of 4.52. This means that Claude's responses, enhanced by text and graph, were consistently rated highly by all models, including itself, across all tests.
Claude, when combined with text and graph, exhibited the lowest variability, with just a 0.37 difference between the highest and lowest scores. This suggests that Claude’s responses were consistently reliable and less prone to performance fluctuations. The low variability also indicates that the three LLMs were in closer agreement on the quality of Claude’s text-and-graph-augmented responses.
Conclusion
This study explored how knowledge graphs can improve the quality of responses from LLMs, focusing on how well these responses align with source material. To measure this improvement, ranking and rating methods were used to quantify response quality.
The findings revealed that neither knowledge graphs nor source materials alone were sufficient to consistently produce high-quality responses. Knowledge graphs, which capture key ideas, concepts and their relationships from source materials, provide valuable context for LLMs. However, when used in isolation, they can lead to responses that, while contextually relevant, may stray from the specific content of the source materials.
Interestingly, using source material alone also proved insufficient. While this approach ensures factual accuracy, it often results in responses lacking the broader context and connections that knowledge graphs provide.
The most promising results came from combining knowledge graphs with source materials. This synergy allows LLMs to navigate the information landscape more effectively. The knowledge graph acts as a conceptual map, similar to a GPS navigation system, guiding the LLM through the terrain of ideas present in the source material. This combination minimizes the chances of the model getting "lost" mid-response and reduces the likelihood of hallucination - the generation of plausible but incorrect information.
By providing both the detailed content (source material) and the structural relationships between concepts (knowledge graph), this approach enables LLMs to generate responses that are both factually grounded and contextually rich. This method shows promise as a cost-effective technique to improve the quality of LLM-generated responses.


